ON THIS PAGE
By Efe Berke Colaker, Founder at GetleadReviewed by the Getlead editorial team for accuracy. Last updated August 2026.
Most outbound programs discover a reputation problem the same way: replies stop, someone asks why. And there is no data older than the current campaign to compare against. The instruments were never installed.
All four of them are free, all four take minutes to set up. And none of them can tell you about the past once you need them. That asymmetry is the whole argument for doing it before you need it.
Here is what each source actually shows, what it cannot show. And the review rhythm that catches a decline while it is still cheap to fix.
Why your sending tool cannot tell you
A sending platform observes two things: whether the receiving server accepted the message, and whether anyone clicked or replied. Everything that decides placement happens after acceptance, inside systems it has no visibility into.
Complaint rate is the clearest example. When a recipient presses report spam, that signal goes to their mailbox provider and stays there. It never travels back to the sender unless you have registered for the provider's own reporting.
This is also why a campaign can report 99% delivery and produce nothing. Delivered means accepted, not read, and the gap between the two is precisely what the four sources below let you observe.
Complaint rate is the share of delivered messages marked as spam, computed inside the mailbox provider and invisible to your sending tool.
The four sources and what each reveals
Postmaster Tools is the one to set up first for most B2B senders. Because domain reputation is the unit that matters when you send from a shared platform where the IP belongs to the vendor.
SNDS is IP oriented, so its usefulness depends on whether you control the sending IP. On a shared platform you may not be able to register it at all. That makes the reply split by provider your main Microsoft signal instead.
DMARC reports are the odd one out: they say nothing about placement and everything about who is sending mail using your domain. That is a security signal first and a deliverability signal second. And it is the reason a reporting address belongs in the record from day one.
Sender reputation is the mailbox provider's running assessment of your domain and IP, computed from complaints, bounces, authentication results and engagement, and held entirely on their side. A mailbox that arrives with weeks of accepted, opened and answered mail behind it starts that assessment somewhere other than zero, which is what a pre-warmed mailbox buys.
For example, a domain sending 2,000 messages a month needs only two spam complaints to sit at 0.1%. That is why the weekly Postmaster Tools check matters more at low volume than most teams assume.
The thresholds that mean act now
Numbers without action levels are decoration. These are the ones worth writing on the wall.
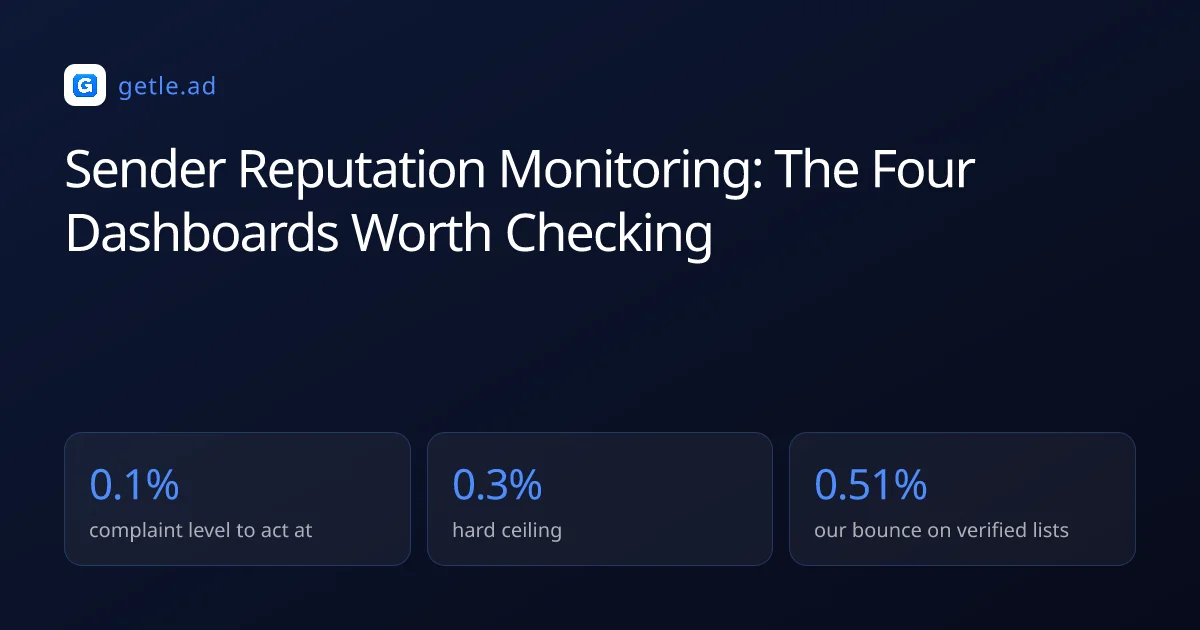
- Complaint rate above 0.1%. Act now. The published ceiling is 0.3%, but reputation is an average and by the time you reach the ceiling the damage is weeks old.
- Domain reputation drops from high to medium. Reduce volume and re-verify before it reaches low, which is much harder to climb back from.
- Authentication pass rate below 100%. Something in your setup is sending unaligned mail. Find it in the DMARC reports.
- Replies per thousand falling while volume holds. The earliest honest sign of a placement problem, often visible before the provider dashboards move.
The complaint threshold is the one most teams misread. Operating at 0.25% feels safe because it is under the ceiling. And it is not: it is four times the recommended level and one bad segment away from enforcement.
Bounce rate belongs in the same review even though it is measured in your own tool. Verified sends in our data bounce at 0.51%. So anything materially higher is a list problem that will become a reputation problem if it repeats.
Why averages lag your behaviour
Reputation systems smooth over time, which cuts both ways. A single bad campaign does not destroy a good history immediately, and a single good week does not repair a bad one. Both facts argue for acting early and being patient afterwards.
In practice that means the moment you see a number move is already later than the moment the behaviour changed. And recovery will take longer than the decline did. Teams that expect symmetry get impatient and push volume back up too fast, which restarts the cycle.
Domain reputation is the provider's rating of the sending domain, which moves as an average and therefore lags your behaviour by weeks.
A review rhythm that survives a busy month
Monitoring fails when it is a project. It works when it is a short recurring habit attached to something that already happens.
- After every campaign: bounce rate by segment, in your sending tool. Two minutes.
- Weekly: Postmaster Tools complaint rate and domain reputation, plus replies per thousand delivered. Ten minutes.
- Monthly: DMARC aggregate summary, checking for unknown senders and alignment failures. Fifteen minutes.
- Quarterly: the full deliverability audit, including seed inbox tests at Gmail, Outlook and Yahoo.
- After any incident: all of the above, and record what the numbers were before and after.
Write the weekly numbers into one file, one line per week. Reputation rarely fails in a single visible step, it declines across three or four campaigns. And a record turns that slope into something you can see rather than something you reconstruct afterwards. The quarterly slot is where the full deliverability audit belongs.
Who owns the check
Name one person. Monitoring that belongs to the team belongs to nobody. And the weekly ten minutes is exactly the kind of task that survives only when someone's name is on it.
The same person should own the decision to stop sending. Reducing volume during a decline is unpopular in the week it happens and obviously correct in hindsight. That is why it needs to be somebody's call rather than a discussion.
What none of them show
Two important things are invisible in all four sources, and knowing that saves you from over trusting a green dashboard.
The first is inbox placement itself. No provider tells you what share of your mail reached the primary inbox rather than spam or promotions. The only way to observe it is seed testing with real accounts, which is why that stays on the quarterly list.
The second is business mailbox filtering. Postmaster Tools covers Gmail, and a Google Workspace mailbox behind a corporate security gateway is a different system with its own rules. B2B lists are full of exactly those mailboxes.
So treat the dashboards as necessary and not sufficient. They catch reputation decline early and cheaply, and the reply rate per thousand delivered remains the number that tells you whether any of it is working.
Sources and method
First-party data (Getlead, 2026): the verification split of 43.4% confirmed valid, 23.9% invalid, 16.7% catch-all and 16.0% unknown comes from 383,368 addresses analyzed through live SMTP verification. And the 0.51% bounce rate comes from 34,973 tracked sends, aggregated and anonymized at campaign level. Full method in our cold email benchmark study.
External sources: complaint rate thresholds, domain reputation reporting and authentication requirements come from the Google Workspace sender guidelines and Postmaster Tools, 2026; DMARC aggregate reporting is specified in RFC 7489.
US commercial email obligations, including accurate headers, a physical postal address and a working opt-out honored within 10 business days, come from the FTC CAN-SPAM compliance guide.
Figures were checked in August 2026.
Frequently asked questions
How do I monitor email sender reputation?
Use four sources: Google Postmaster Tools for Gmail complaint rate and domain reputation, Microsoft SNDS for Outlook traffic, DMARC aggregate reports for authentication and unknown senders. And replies per thousand delivered from your own data. All four are free.
Can my sending tool show my sender reputation?
No. A sending platform sees whether a server accepted the message and whether someone replied. Complaint rate and reputation are computed inside the mailbox provider and never travel back to the sender unless you register for the provider's own reporting.
What complaint rate should trigger action?
0.1%. The published hard ceiling is 0.3%, but reputation is a moving average, so waiting for the ceiling means acting weeks after the damage started. Treat 0.1% as the level where you stop and investigate the segment.
How often should I check reputation dashboards?
Bounce rate after every campaign, Postmaster Tools and replies per thousand weekly, DMARC summaries monthly, and a full audit with seed inbox tests quarterly. Record the weekly numbers, since decline usually shows as a slope rather than a single failure.
Do reputation dashboards show inbox placement?
No. No provider reports what share of your mail reached the primary inbox rather than spam or promotions. Seed testing with real accounts at Gmail, Outlook and Yahoo is the only way to observe placement directly.
What if I cannot register for Microsoft SNDS?
SNDS is IP based, so on a shared sending platform the IP belongs to your vendor and you may not be able to register. In that case use the reply rate split by recipient provider as your Microsoft signal, and watch bounce rates for Outlook domains separately.